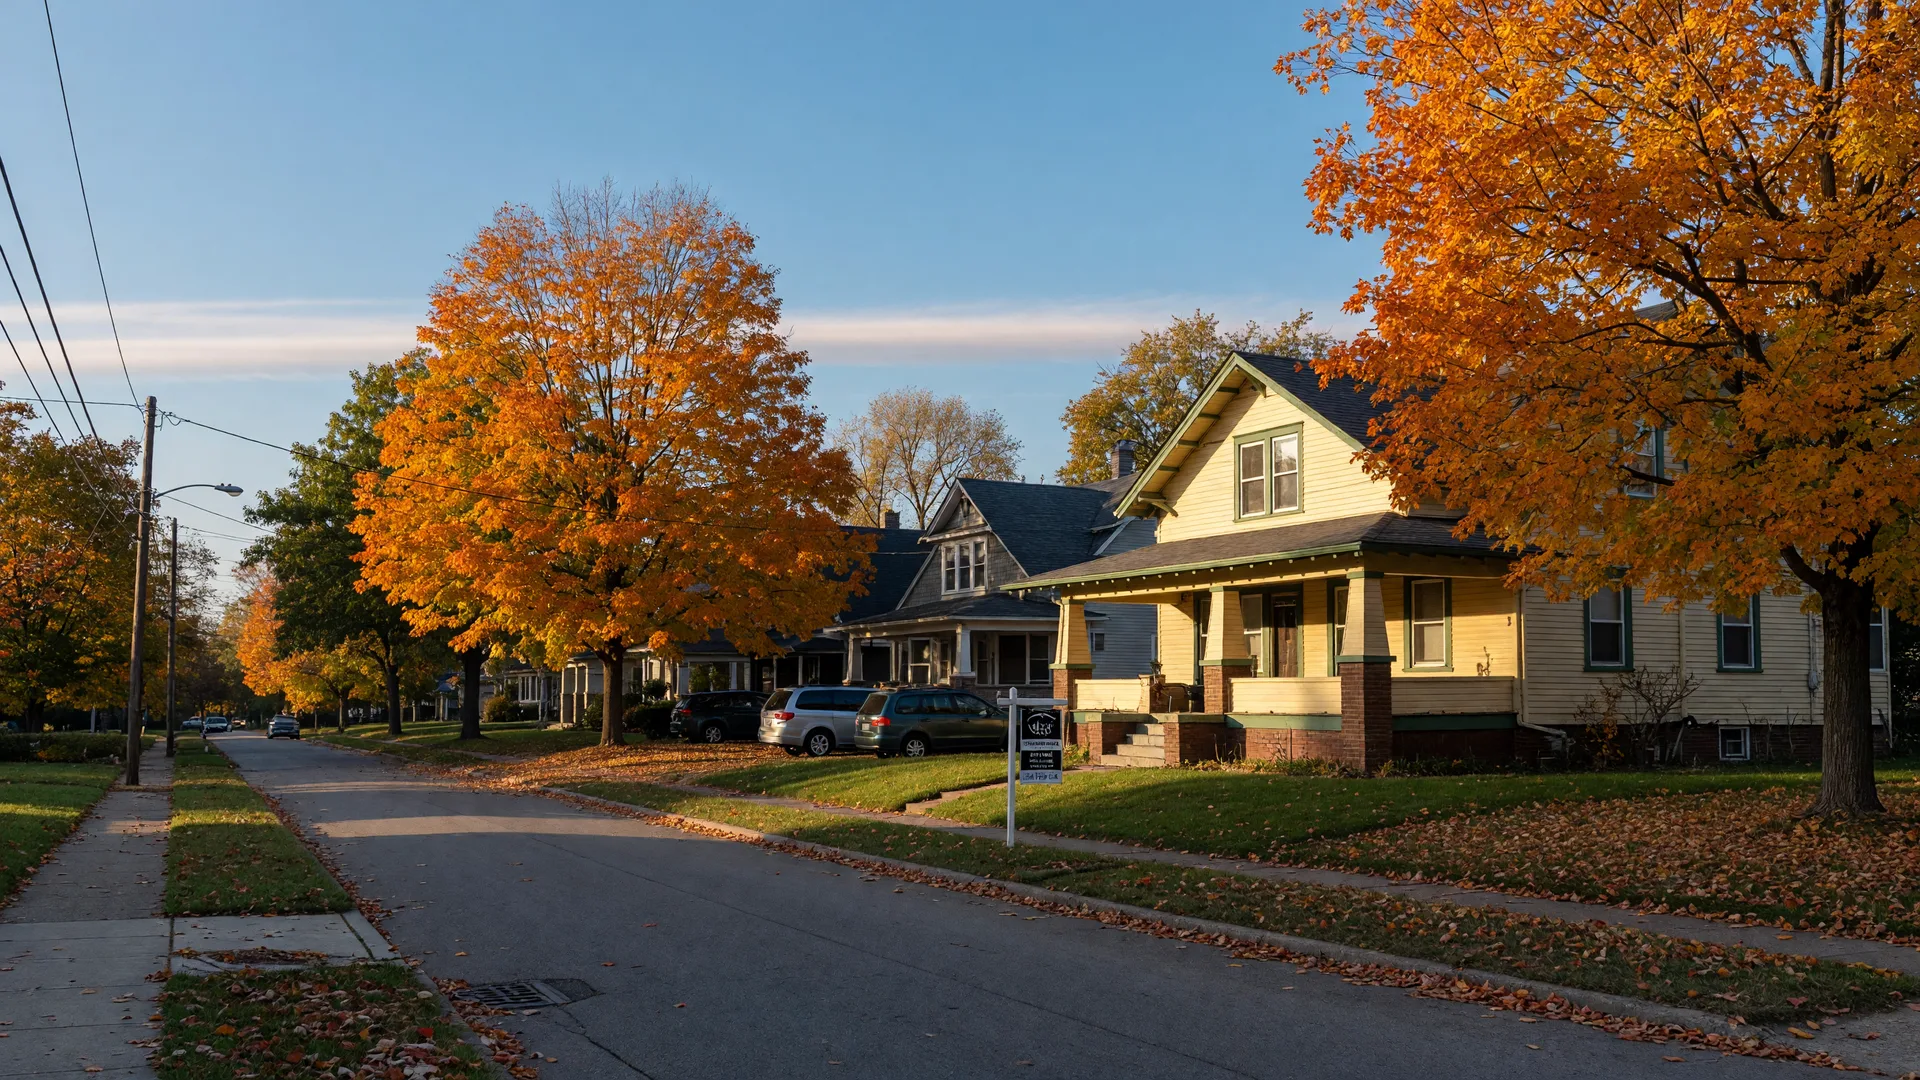
The week after rates crossed 7 percent, they kept climbing. Freddie Mac's survey for the week ending October 1 averaged 7.28% for a 30-year fixed mortgage, the highest reading in months, and daily trackers are clustering near that same level. The good news for buyers and sellers in our communities: the local market is still moving, prices are still climbing at a calmer pace, and the September report due mid-month will tell us how the fall season is really shaping up. Let's walk through the numbers with sources.
Rates: The First October Reading Is 7.28%
Freddie Mac's Primary Mortgage Market Survey averaged 7.28% for a 30-year fixed mortgage for the week ending October 1, 2026, up from 7.03% the prior week and from 6.34% a year earlier. The series is published every Thursday at freddiemac.com/pmms, and it is the first reading of the new month, so it resets the conversation: rates have now moved well past the 7 percent line that felt like a ceiling in September.
Independent trackers agree. LendingTree's average for 30-year purchase loans is running around 7.25%, and most daily rate sheets for well-qualified buyers are landing between about 7.1% and 7.4%. The driver is the same story from mid-September: the Federal Reserve raised its target range to 3.75%-4.00% on September 16, its first increase since 2023, and mortgage rates have been repricing since. The next Fed decision is the October 27-28 meeting, so expect rates to float in this low-to-mid 7 range for the rest of the month. That is not a reason to panic, and it is not a reason to wait on a home you love. It is a reason to know your number and lock when your lender quotes a rate your budget can live with.
The National Picture: More Homes, Slower Sales
The National Association of Realtors' August existing-home sales report, released September 10, still frames the national backdrop: sales running at a 3.98 million seasonally adjusted annual rate, down 2.0% from July and 1.2% from a year ago, a national median existing-home price of $429,100, up 1.6% year over year, and unsold inventory at a 4.9-month supply, the highest in more than a decade, with 1.62 million homes on the market. You can read the full release at nar.realtor.
In plain English: buyers nationally have more choices and less pressure than at any point in the past ten years, and sellers are seeing homes take longer to sell than they did during the frenzy years. That backdrop has not changed with this week's rate move, and it is the environment Cincinnati buyers and sellers are working in this fall.
The Local Report Card: August in the Books, September Coming
The REALTOR Alliance of Greater Cincinnati's August report, the standard local benchmark covering Butler, Clermont, Clinton, Hamilton, and Warren counties, shows a median sold price of $329,000, up 4.5% year over year, with 1,741 homes sold, up 1.9%, and a year-to-date median of $322,161, up 4.9%. Active inventory stood at 3,098 listings, up 6.8%, new listings came in at 2,278, up 2.6%, and the median days on market was 10, up from 8 a year ago. You can follow the county-by-county detail at cincyrealtoralliance.com. The September report is due in mid-October, and it will be the first full look at how the fall season is actually behaving under higher rates.
The county lens matters for our communities. Warren County, home to most of Maineville, Morrow, South Lebanon, and Landen, shows a median sale price around $414,000, up about 7.4% year over year, with a median price per square foot around $197, up 6.8%, and homes averaging roughly 43 days on market. Clermont County, where Goshen sits, is around $339,000 over the three months ending in August, up 5.8%. And Hamilton County, where southwestern Loveland reaches, is around $270,000, up 3.4%. The St. Louis Fed's days-on-market series for the Cincinnati metro shows a median of about 42 days in August, up from 40 in July. Taken together: prices are still climbing at a calmer pace, and homes are selling on a normal, human timeline again.
What to Watch in October
Three things are on my calendar this month. First, the September RAGC report, due mid-October, which will show whether the fall inventory build continued and how prices held through the rate jump. Second, the Federal Reserve's October 27-28 meeting, the first chance for rates to react to the September hike's effects. Third, the seasonal rhythm itself: the strongest showing weeks of the fall run from now through mid-November, before the Thanksgiving slowdown, and this October is packed with reasons to be out in the neighborhoods, from BLINK's light installations this week to the Ohio Sauerkraut Festival, pumpkin season at Blooms & Berries, and trick-or-treat nights in Loveland, Maineville, and Morrow. See what is happening near you on the community events page.
What I'd Tell Buyers This Week
- Get pre-approved before you tour. At rates above 7%, your qualifying price is what it is, and knowing your number before you fall for a house makes every offer stronger and faster.
- Lock when the number works. Rates are moving week to week right now. When your lender quotes a rate your budget handles, locking removes the October 27-28 Fed meeting from your anxiety list.
- Compare offers on terms, not just price. In a balanced market, seller-paid closing costs or a temporary buydown often matter more than squeezing the list price, and sellers are listening.
- Tour in the first half of October. Fresh fall listings are arriving now, and the strongest buyers are out before the holidays. The best homes of the season tend to hit in the next few weeks.
What I'd Tell Sellers This Week
- Price on current comps, not last spring's. Buyers qualify at today's higher rates, and a realistic list price is what gets your home seen and shown in the first place.
- List before Thanksgiving. The strongest buyer pool of the season is touring right now. Homes listed in the next six weeks get the most showings before the market naturally slows.
- Present for October showings. Raked leaves, seasonal mums, bright interior light, and a warm first impression all matter more when buyers have dozens of homes to compare.
- Expect and prepare for negotiation. Concessions like closing-cost help are becoming routine. Sellers who stay flexible on terms are closing, often inside the metro's 42-day average.
The Bottom Line
Rates jumped to 7.28% to open October, and that is the headline number this week. But the local market underneath it is still workable: Cincinnati prices are up a modest 4.5%, inventory is the healthiest it has been in years, and homes are selling on a normal timeline. Buyers have choices and room to negotiate, and sellers who price and present well are still finding buyers. The September local report and the Fed's late-month meeting are the two dates that could move the story, so if you are thinking about a move, the next six weeks are the window. If you would like to run your numbers at today's rates, or see what your home is worth in this market, I would love to sit down with you, no obligation.
You can catch up on last week's market update, my fall 2026 playbook, or the ground rules for structuring a competitive offer. And as always, watch the community events page for what is happening around Loveland, Maineville, and Morrow this fall. Love where you live.

Marti Lawson
Realtor at eXp Realty · Cincinnati Area
OH License #2021002844